· Guides · 11 min read
Where Does Your Fishing License Money Go? The $1.5 Billion System Explained (2026)
Reviewed by FishKillFlea Editorial Team
Ever wonder what happens to your $25 fishing license fee? It funds a $1.5 billion conservation system that stocks fish, restores habitats, and gives you better fishing. Here's the complete financial breakdown.
Your $25 fishing license doesn’t just buy you permission to fish. It’s an entry ticket into a $1.5 billion conservation machine that has been stocking America’s waters, protecting habitats, and building public boat ramps since 1950. Most anglers have no idea how this system works — or why every dollar they spend actually comes back to them as better fishing. Here’s where your money really goes.
The Two Money Streams: Your $25 Journey
When you buy a fishing license, your money enters two separate but connected funding systems:
| Stream | Source | Annual Total (2024) | What It Funds |
|---|---|---|---|
| Stream 1: State license revenue | Your license fee goes directly to your state’s fish & wildlife agency | ~$900 million nationwide | Staff, hatcheries, enforcement, operations |
| Stream 2: Federal matching funds | Federal excise taxes on fishing gear trigger matching grants to your state | $750 million (Sport Fish Restoration Trust Fund) | Habitat, research, boat access, stocking |
Combined total: approximately $1.5 billion per year flows into America’s fisheries management system — making recreational anglers the single largest funders of freshwater conservation in the country.
The key insight: Your license fee isn’t just a fee. It’s a multiplier. Every dollar your state collects in license revenue unlocks up to three additional federal dollars through the Dingell-Johnson matching system (explained below).
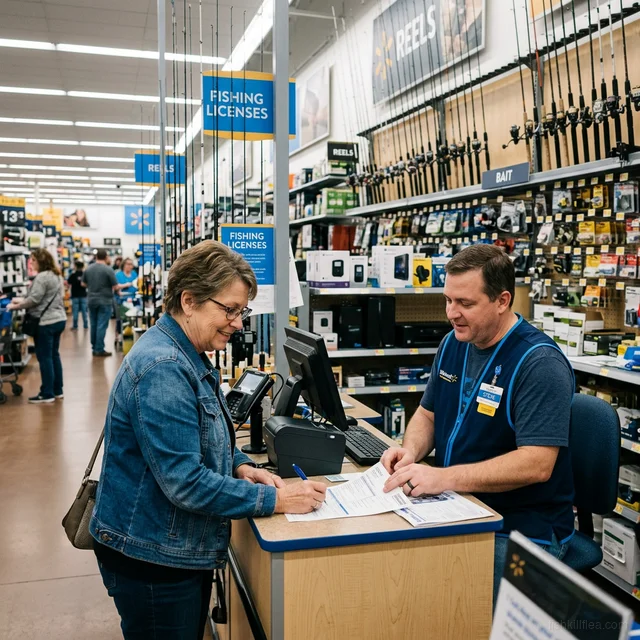
Stream 1: Where Your State License Fee Goes
When you pay $25 for a fishing license, that money goes directly to your state fish and wildlife agency. By federal law (the Assent Legislation requirement), states are prohibited from diverting fishing license revenue to any purpose other than fish and wildlife management. Your governor can’t redirect it to roads, schools, or general fund. It must go to fishing.
Typical State Budget Breakdown
While exact percentages vary by state, here’s how most state agencies allocate fishing license revenue:
| Category | Typical Share | What It Covers |
|---|---|---|
| Fish hatcheries & stocking | 25–35% | Raising and releasing trout, bass, walleye, catfish, and other sport fish into public waters |
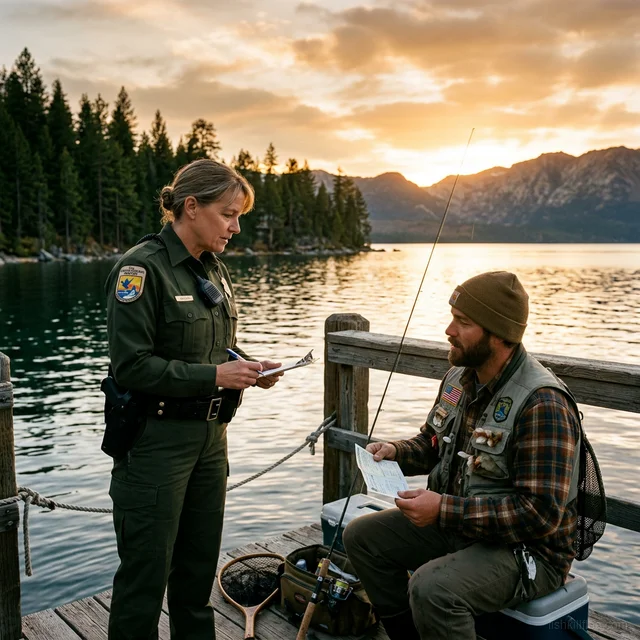
| Law enforcement | 20–25% | Game warden salaries, patrol boats, equipment, investigation of poaching |
| Habitat management | 15–20% | Stream restoration, dam removal, water quality monitoring, invasive species control |
| Administration | 10–15% | Processing licenses, managing databases, agency operations |
| Public access | 5–10% | Boat ramps, fishing piers, parking areas, ADA-accessible facilities |
| Research & surveys | 5–10% | Fish population studies, creel surveys, species management plans |
| Education & outreach | 3–5% | Youth fishing programs, angler education, hunter safety courses |
Real State Examples
Texas Parks & Wildlife Department (TPWD)
- License revenue: ~$100 million/year (hunting + fishing combined)
- Operates 5 freshwater fish hatcheries producing 40+ million fish annually
- Employs ~530 game wardens statewide
- Maintains 89 state parks with fishing access
Florida Fish & Wildlife Conservation Commission (FWC)
- License revenue: ~$50 million/year (fishing only)
- Manages 175+ fish management areas
- Stocks approximately 6 million fish annually
- Supports artificial reef construction — over 3,500 permitted reef sites
Montana Fish, Wildlife & Parks (FWP)
- License revenue: ~$45 million/year
- Manages 16 million acres of public fishing access
- Operates 7 warm-water and cold-water fisheries management programs
- Funds stream access site maintenance

Pflueger President Spinning Reel
Smooth 10-bearing system. Great value for freshwater fishing.
Affiliate link · Prices may vary
Stream 2: The Federal Multiplier — Dingell-Johnson Act
Here’s where the system gets powerful. In 1950, Congress passed the Dingell-Johnson Act (officially the Federal Aid in Sport Fish Restoration Act), creating a mechanism that multiplies your license fee investment.
How It Works
You buy fishing tackle (rod, reel, line, lures)
         ↓
Federal excise tax (10% on tackle, 3% on electric trolling motors and fish finders)
         ↓
Revenue deposited into the Sport Fish Restoration and Boating Trust Fund
         ↓
Distributed to all 50 states + territories based on formula
         ↓
States use funds for fisheries projects (with 25% state match — often from YOUR license fees)
The Numbers (2024)
| Metric | Amount |
|---|---|
| Total Trust Fund revenue | ~$750 million |
| Sport Fish Restoration portion distributed to states | $381+ million |
| Boating safety portion | Built into distribution |
| Administrative costs (USFWS) | ~6% |
How States Get Their Share
The federal funds aren’t distributed equally. They follow a formula:
| Factor | Weight | What It Means |
|---|---|---|
| Number of paid license holders | 60% of formula | States with more licensed anglers get more money |
| State land + water area | 40% of formula | Larger states (Alaska, Texas) get proportionally more |
| Minimum floor | 1% of total | Even small states get at least ~$3.8 million |
| Maximum cap | 5% of total | No state gets more than ~$19 million (prevents California/Texas dominance) |
Top Federal Allocations by State (FY 2025)
| State | Federal Allocation | Why |
|---|---|---|
| Alaska | $20.8 million | Massive area + strong license sales |
| California | $19.0 million | Hitting the 5% cap — huge license base |
| Texas | $18.5 million | Near the 5% cap — enormous area + anglers |
| Florida | $16.2 million | Huge angler population |
| Minnesota | $14.8 million | ”Land of 10,000 Lakes” — extremely high license rate |
| Michigan | $13.5 million | Great Lakes fisheries + high participation |
| Wisconsin | $12.1 million | Very high per-capita fishing participation |
| Illinois | $7.0 million | Combined with ~$2.3M state match = $9.3M total |
The 75/25 Match
To access federal funds, states must provide a 25% match from non-federal sources. This match almost always comes from — you guessed it — fishing license fees.
Example: If Illinois gets $7 million in federal Dingell-Johnson funds, it must contribute $2.3 million of its own money (from license sales) to unlock that federal money. Total project funding = $9.3 million.
This is why your license fee is a multiplier: Your $25 license fee funds the state match that unlocks 3x more federal money. Every license sold increases the state’s share of the federal pie (60% of the formula is based on license count) AND provides match funding. Not buying a license literally costs your state money.
The Excise Tax You Don’t See
Every time you buy fishing gear, you pay a federal excise tax that funds fisheries — even if you don’t know it:
| Product | Tax Rate | Example |
|---|---|---|
| Fishing rods | 10% | $100 rod → $10 to Trust Fund |
| Reels | 10% | $80 reel → $8 to Trust Fund |
| Fishing line | 10% | $15 line → $1.50 to Trust Fund |
| Lures, flies, hooks | 10% | $5 lure pack → $0.50 to Trust Fund |
| Electric trolling motors | 3% | $500 motor → $15 to Trust Fund |
| Fish finders / sonar | 3% | $300 unit → $9 to Trust Fund |
| Tackle boxes, nets | 10% | $25 box → $2.50 to Trust Fund |
| Motorboat fuel (portion) | Varies | A share of federal gas tax on boat fuel |
Annual total from excise taxes: Approximately $400+ million
This tax is built into the retail price — you never see a separate line item. Manufacturers collect it and remit to the IRS, which deposits it into the Trust Fund. It’s the same concept as the Pittman-Robertson Act for hunting (11% excise tax on firearms and ammunition).
The virtuous cycle: You buy a $100 fishing rod → $10 goes to the Trust Fund → Your state gets a share → That money stocks fish in your local lake → You catch more fish → You buy more gear → More money flows back. Anglers fund their own sport.

Ugly Stik Elite Spinning Rod
Premium Ugly Stik with improved sensitivity and lighter weight.
As an Amazon Associate, we earn from qualifying purchases. Prices may vary.
What Your Money Actually Builds
Here are real examples of what the combined license fees and federal funds have created:
Fish Hatcheries
- US operates 70+ federal hatcheries and hundreds of state hatcheries
- Combined, they produce billions of fish annually for stocking public waters
- A single hatchery trout costs approximately $1.50–$3.00 to raise from egg to stockable size (8–12 inches)
- A typical state stocks 2–40 million fish per year depending on size and habitat
Stream & Habitat Restoration
- Dam removal projects (restoring fish passage on historically blocked rivers)
- Riparian buffer planting (trees along stream banks to cool water temperature for trout)
- Invasive species removal (e.g., Asian carp barriers on the Great Lakes)
- Water quality monitoring at thousands of sample sites nationwide
Public Access
- Fishing piers at state parks and urban waterfronts
- Boat ramps — thousands built and maintained with Trust Fund money
- ADA-accessible fishing platforms for anglers with disabilities
- Parking areas and access roads at remote fishing spots
Research
- Annual creel surveys (counting what anglers catch to set sustainable limits)
- Fish population electro-shocking surveys
- Genetic studies on native vs. stocked fish populations
- Climate impact research on cold-water fisheries
The Math: Is a $25 License Worth It?
Let’s calculate the return on your $25 investment:
| What You Get | Value |
|---|---|
| Legal fishing access to all public waters in your state for 365 days | Priceless (otherwise $50–$500 fine) |
| Fish stocking — your state stocks millions of fish annually | Your share: thousands of catchable fish added to your local waters |
| Game warden protection — wardens enforce against poaching that would deplete your fishery | Sustainable fish populations |
| Habitat maintenance — stream and lake habitat improvements | Better water quality, more fish |
| Federal fund multiplier — your $25 helps unlock ~$75 in federal conservation money | 3:1 return ratio |
| Boat ramps and access — public infrastructure you use for free | Your share of millions in access construction |
Bottom line: Your $25 license is probably the best value in outdoor recreation. No other $25 investment gives you 365 days of access to public resources, directly funds the resource you’re using, and triggers 3x matching federal investment.
Compare this to other outdoor activities: A single day of skiing costs $100–$200. A golf round costs $30–$80. A national park annual pass costs $80. Your state fishing license — covering every public water for an entire year — costs $15–$55.

Penn Pursuit IV Spinning Combo
Rod and reel combo ready to fish out of the box. Great value for new anglers.
Affiliate link · Prices may vary
Why License Sales Numbers Matter
The federal funding formula means every license sold directly increases your state’s share of $381+ million in federal funding. Here are the states with the highest fishing license participation rates:
| State | Licenses Sold (Annual) | Per Capita Fishing Rate | Federal Benefit |
|---|---|---|---|
| Minnesota | ~1.5 million | ~26% of population | Top-tier allocation |
| Wisconsin | ~1.3 million | ~22% of population | Top-tier allocation |
| Michigan | ~1.2 million | ~12% of population | Top 10 allocation |
| Texas | ~2.1 million | ~7% of population | Near 5% cap |
| Florida | ~2.5 million | ~11% of population | Top 5 allocation |
When you buy a license, you’re voting with your wallet. States with more licensed anglers get more federal conservation dollars. States with declining license sales lose federal funding — and eventually, fishing quality declines as hatcheries reduce output and habitat projects get cut.
The Conservation Compact: A System Unlike Anything Else
The American fishing license system is unique in the world. It creates a direct feedback loop between the people who use a natural resource and the funding that maintains it:
- Anglers buy licenses → State agency revenue
- Anglers buy gear → Federal excise tax revenue (Trust Fund)
- Federal funds flow to states → Based on number of license holders (60%) and state size (40%)
- State license fees provide 25% match → Unlocks 75% federal funding
- Combined funds stock fish, restore habitat, build access → Better fishing
- Better fishing attracts more anglers → More licenses and gear sold
- Cycle repeats
No tax increase, no congressional appropriation, no political debate. The system is self-funding and has operated continuously since 1950 — over 75 years.
This model is called the American System of Conservation Funding, and it’s considered one of the most successful conservation finance mechanisms ever created. Other countries study it. Environmental organizations praise it. And it all starts with your $25 fishing license.
Frequently Asked Questions
Where does my fishing license money go? Directly to your state’s fish and wildlife agency. By federal law, states cannot divert fishing license revenue to any non-wildlife purpose. The money funds fish stocking, game warden salaries, habitat restoration, boat ramps, and fisheries research. Your license fee also serves as match funding that unlocks 3x more federal conservation dollars through the Dingell-Johnson Act.
How much money does fishing generate for conservation? Approximately $1.5 billion annually — roughly $900 million from state license sales and $750 million from the federal Sport Fish Restoration and Boating Trust Fund (funded by excise taxes on fishing equipment). This makes recreational anglers the largest funders of freshwater conservation in the United States.
What is the Dingell-Johnson Act? The Federal Aid in Sport Fish Restoration Act (1950), commonly called Dingell-Johnson, established a system where federal excise taxes on fishing equipment are collected and distributed to all 50 states for fisheries management. States must provide a 25% match (typically from license fees) to receive the 75% federal share. In 2024, over $381 million was distributed to states through this program.
Does buying a license actually help fish populations? Yes — directly and measurably. License revenue funds fish hatcheries that stock billions of fish annually, habitat restoration that improves wild fish populations, and law enforcement that prevents poaching. States with strong license sales (Minnesota, Wisconsin) consistently rank among the best fishing destinations because they receive the most conservation funding.
What if I never fish — should I still buy a license? If you value having fishable public waters, buying a license supports the system — even if you don’t use it every year. Some conservation organizations encourage “conservation licenses” for this reason. But practically, the system relies primarily on active anglers who also buy gear (funding the excise tax stream).
Why do non-resident licenses cost more? Residents fund their state’s fisheries year-round through state taxes, local fees, and years of license purchases. Non-resident rates subsidize the fact that visiting anglers consume resources (fish, boat ramps, warden time) without contributing to the long-term funding base. The price difference ($40–$100 more) is the state’s way of ensuring visitors pay their fair share of conservation costs.
Is my fishing license tax-deductible? Generally no — recreational fishing licenses are not tax-deductible. However, if you hold a commercial fishing license and fish for income, those license costs are business expenses.
Already have your license? Check fishing license costs by state, or learn about exemptions that could save you money. New to fishing? Our beginner’s guide walks you through getting your first license in 5 minutes. See your state’s full regulations for local details.